E1.06: Graphs Part 2
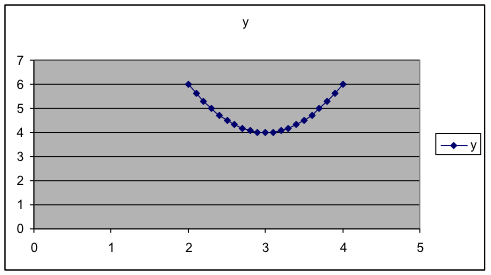
Example 9. Just by sketching some more of the graph, estimate the y-value of [latex]y=4+2{{(x-3)}^{2}}[/latex] when [latex]x=14[/latex]. Solution: Extend the graph a bit and find that it appears to give [latex]y=250[/latex]. Check: Check this by plugging [latex]x=14[/latex] into the formula, [latex]y=4+2{{(x-3)}^{2}}=4+2{{(14-3)}^{2}}=4+2{{(11)}^{2}}=246[/latex] Example 10. Use the graph to estimate which x gives the lowest value for y when [latex]y=4+2{{(x-3)}^{2}}[/latex] on the values [latex]0\le{x}\le12[/latex]. Solution: That x-value is clearly between 0 and 5. It appears to be a bit above halfway. So we estimate that it is about [latex]x=3[/latex]. Example 11. Let’s “magnify” the portion of the graph near [latex]x=3[/latex] in order to see very precisely where the minimum value is. Actually, we leave the old dataset and graph alone and produce a new one. This time, we’ll just use x values near 3. So we’ll graph [latex]y=4+2{{(x-3)}^{2}}[/latex] on the values [latex]2\le{x}\le4[/latex] where we increase the x-values in increments of 0.1. Use the same technique as before. Here is the middle part of the data table and the graph. This makes clear that [latex]x=3[/latex] gives the minimum value for y.
|
 |
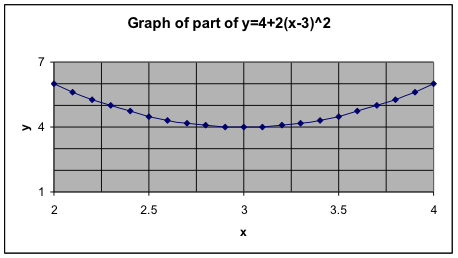 |
While making the graph, in Step 3 of 4, click on some of the tabs at the top and change something. Titles: Put the labels you want. Gridlines: Check all four boxes for major and minor gridlines for both variables. Legend: Uncheck “Show Legend.” After the graph is made, move your cursor on top of some value on the x-axis and double click. In the resulting box, choose the Scale tab and then fill in the four boxes. I used 2 to 4, with major gridlines at 0.5 and minor gridlines at 0.25. Then do the same thing for the y-axis, but from 1 to 7, with major gridlines at 3 and minor gridlines at 1. |
Licenses & Attributions
CC licensed content, Shared previously
- Mathematics for Modeling. Authored by: Mary Parker and Hunter Ellinger. License: CC BY: Attribution.
