Functions and Models
Four Ways to Represent a Function
Functions can be expressed in four different ways.Learning Objectives
Express a function verbally, algebraically, numerically, and graphicallyKey Takeaways
Key Points
- A function can be represented verbally. For example, the circumference of a square is four times one of its sides.
- A function can be represented algebraically. For example, [latex]3x+6[/latex].
- A function can be represented numerically.
- A function can be represented graphically.
Key Terms
- function: a relation in which each element of the domain is associated with exactly one element of the co-domain
Essential Functions for Mathematical Modeling
Mathematical models are used to explain systems, study effects of components, and make predictions about behavior.Learning Objectives
Discuss the uses of mathematical modelsKey Takeaways
Key Points
- A mathematical model is a description of a system using mathematical concepts and language.
- Mathematical models are used in the natural sciences, engineering disciplines, and in the social sciences.
- Mathematical models can take many forms, including but not limited to dynamical systems, statistical models, differential equations, or game theoretic models.
Key Terms
- map projection: any systematic method of transforming the spherical representation of parallels, meridians and geographic features of the Earth's surface to a nonspherical surface, usually a plane
- exponential growth: The growth in the value of a quantity, in which the rate of growth is proportional to the instantaneous value of the quantity; for example, when the value has doubled, the rate of increase will also have doubled. The rate may be positive or negative.
- mathematical model: An abstract mathematical representation of a process, device or concept; it uses a number of variables to represent inputs, outputs and internal states, and sets of equations and inequalities to describe their interaction.
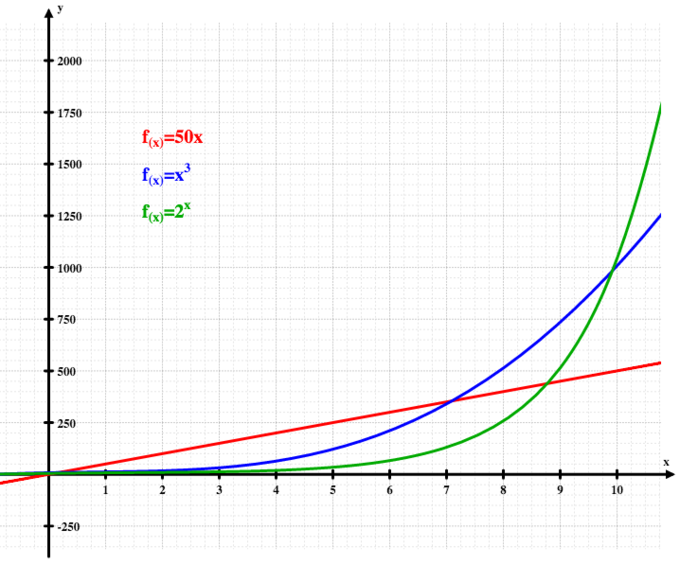
Exponential Growth: The graph illustrates how exponential growth (green) surpasses both linear (red) and cubic (blue) growth.
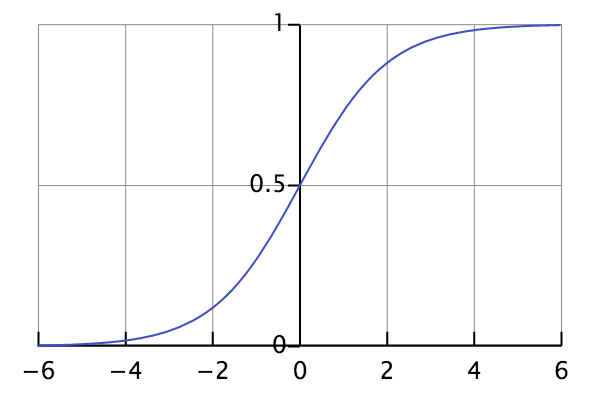
Logistic Curve: The standard logistic curve.
Licenses & Attributions
CC licensed content, Shared previously
- Curation and Revision. Provided by: Boundless.com License: CC BY-SA: Attribution-ShareAlike.
CC licensed content, Specific attribution
- Function (mathematics). Provided by: Wikipedia License: CC BY-SA: Attribution-ShareAlike.
- Kenny Felder, Function Concepts -- Four Ways to Represent a Function. September 17, 2013. Provided by: OpenStax CNX Located at: https://cnx.org/contents/fb1f54e8-a6c6-4f39-b29b-9e267b0e3dd6@3. License: CC BY: Attribution.
- function. Provided by: Wiktionary Located at: https://en.wiktionary.org/wiki/function. License: CC BY-SA: Attribution-ShareAlike.
- Logistic function. Provided by: Wikipedia License: CC BY-SA: Attribution-ShareAlike.
- Derivative. Provided by: Wikipedia License: CC BY-SA: Attribution-ShareAlike.
- Malthusian growth model. Provided by: Wikipedia License: CC BY-SA: Attribution-ShareAlike.
- Mathematical model. Provided by: Wikipedia License: CC BY-SA: Attribution-ShareAlike.
- Logarithm. Provided by: Wikipedia License: CC BY-SA: Attribution-ShareAlike.
- mathematical model. Provided by: Wiktionary License: CC BY-SA: Attribution-ShareAlike.
- exponential growth. Provided by: Wiktionary License: CC BY-SA: Attribution-ShareAlike.
- map projection. Provided by: Wiktionary License: CC BY-SA: Attribution-ShareAlike.
- Logistic-curve.svg. Provided by: Wikipedia License: CC BY-SA: Attribution-ShareAlike.
- Exponential.svg. Provided by: Wikipedia License: CC BY-SA: Attribution-ShareAlike.
