Plot Points on the Coordinate Plane
Learning Objectives
- Define the components of the Cartesian coordinate system
- Plot points on the Cartesian coordinate plane
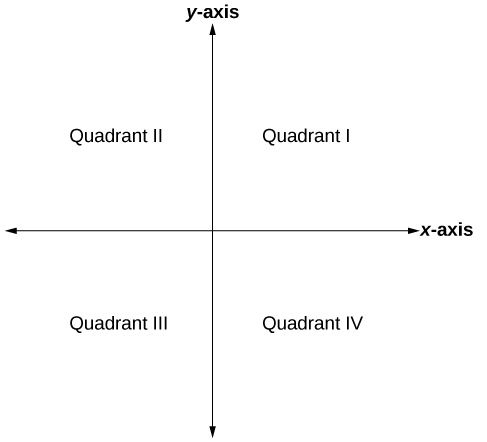 Figure 2
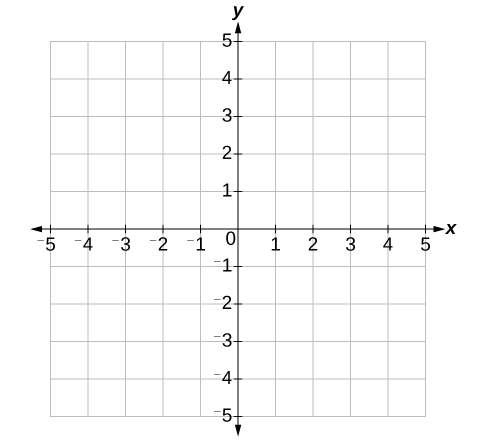 Figure 3
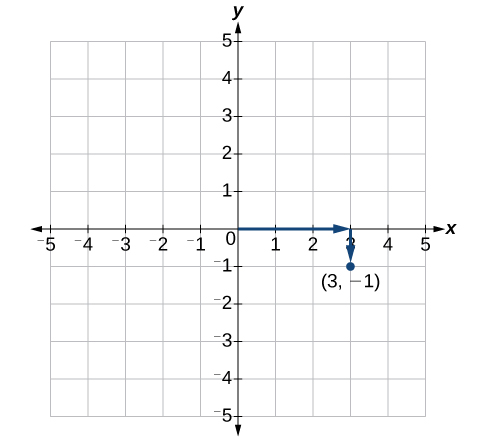 Figure 4
A General Note: Cartesian Coordinate System
A two-dimensional plane where the- x-axis is the horizontal axis
- y-axis is the vertical axis
Example: Plotting Points in a Rectangular Coordinate System
Plot the points [latex]\left(-2,4\right)[/latex], [latex]\left(3,3\right)[/latex], and [latex]\left(0,-3\right)[/latex] in the plane.Answer: To plot the point [latex]\left(-2,4\right)[/latex], begin at the origin. The x-coordinate is –2, so move two units to the left. The y-coordinate is 4, so then move four units up in the positive y direction. To plot the point [latex]\left(3,3\right)[/latex], begin again at the origin. The x-coordinate is 3, so move three units to the right. The y-coordinate is also 3, so move three units up in the positive y direction. To plot the point [latex]\left(0,-3\right)[/latex], begin again at the origin. The x-coordinate is 0. This tells us not to move in either direction along the x-axis. The y-coordinate is –3, so move three units down in the negative y direction. See the graph in Figure 5.
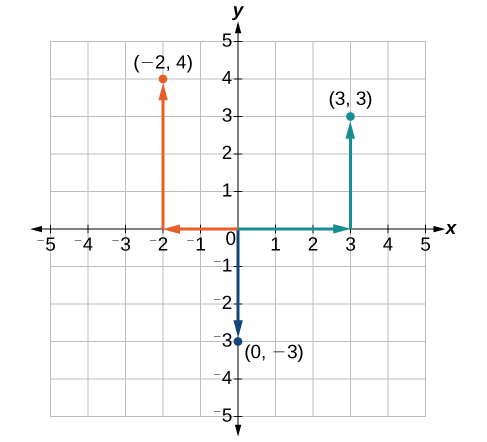 Figure 5
Analysis of the Solution
Note that when either coordinate is zero, the point must be on an axis. If the x-coordinate is zero, the point is on the y-axis. If the y-coordinate is zero, the point is on the x-axis.Key Takeaways
You can use Desmos to practice plotting points on the Cartesian Coordinate plane. Watch the following short video to learn how! https://youtu.be/eS6kabG2omI?list=PLfM6zMGnbgOGLZc-_Yj3QVK3Vz_L4Cw59 Now try plotting the following points with Desmos. [latex-display](4,0)[/latex-display] [latex-display](-1,5)[/latex-display] [latex-display](0,-10)[/latex-display] [latex-display](2,7)[/latex-display] [latex-display](3,-5)[/latex-display] [latex-display](-4,-7)[/latex-display]Licenses & Attributions
CC licensed content, Original
- Revision and Adaptation. Provided by: Lumen Learning License: CC BY: Attribution.
CC licensed content, Shared previously
- College Algebra. Provided by: OpenStax Authored by: Abramson, Jay et al.. License: CC BY: Attribution. License terms: Download for free at http://cnx.org/contents/[email protected].
- Learn Desmos: Points. Authored by: Desmos. License: All Rights Reserved. License terms: Standard YouTube License.
- Question ID 92752, 92753. Authored by: Michael Jenck. License: CC BY: Attribution. License terms: IMathAS Community License, CC-BY + GPL.
CC licensed content, Specific attribution
- College Algebra. Provided by: OpenStax Authored by: OpenStax College Algebra. Located at: https://cnx.org/contents/[email protected]:1/Preface. License: CC BY: Attribution.
