Interval and Set-Builder Notation
Learning Objectives
- Represent inequalities on a number line
- Represent inequalities using interval notation
- Set-builder notation
Represent inequalities on a number line
First, let's define some important terminology. An inequality is a mathematical statement that compares two expressions using the ideas of greater than or less than. Special symbols are used in these statements. When you read an inequality, read it from left to right—just like reading text on a page. In algebra, inequalities are used to describe large sets of solutions. Sometimes there are an infinite amount of numbers that will satisfy an inequality, so rather than try to list off an infinite amount of numbers, we have developed some ways to describe very large lists in succinct ways. The first way you are probably familiar with—the basic inequality. For example:- [latex]{x}\lt{9}[/latex] indicates the list of numbers that are less than 9. Would you rather write [latex]{x}\lt{9}[/latex] or try to list all the possible numbers that are less than 9? (hopefully, your answer is no)
- [latex]-5\le{t}[/latex] indicates all the numbers that are greater than or equal to [latex]-5[/latex].
- [latex]x\lt5[/latex] means all the real numbers that are less than 5, whereas;
- [latex]5\lt{x}[/latex] means that 5 is less than x, or we could rewrite this with the x on the left: [latex]x\gt{5}[/latex] note how the inequality is still pointing the same direction relative to x. This statement represents all the real numbers that are greater than 5, which is easier to interpret than 5 is less than x.
 And the third way is with an interval.
We will explore the second and third ways in depth in this section. Again, those three ways to write solutions to inequalities are:
And the third way is with an interval.
We will explore the second and third ways in depth in this section. Again, those three ways to write solutions to inequalities are:
- an inequality
- an interval
- a graph
Inequality Signs
The box below shows the symbol, meaning, and an example for each inequality sign. Sometimes it's easy to get tangled up in inequalities, just remember to read them from left to right.| Symbol | Words | Example |
|---|---|---|
| [latex]\neq [/latex] | not equal to | [latex]{2}\neq{8}[/latex], 2 is not equal to 8. |
| [latex]\gt[/latex] | greater than | [latex]{5}\gt{1}[/latex], 5 is greater than 1 |
| [latex]\lt[/latex] | less than | [latex]{2}\lt{11}[/latex], 2 is less than 11 |
| [latex] \geq [/latex] | greater than or equal to | [latex]{4}\geq{ 4}[/latex], 4 is greater than or equal to 4 |
| [latex]\leq [/latex] | less than or equal to | [latex]{7}\leq{9}[/latex], 7 is less than or equal to 9 |
Graphing an Inequality
Inequalities can also be graphed on a number line. Below are three examples of inequalities and their graphs. Graphs are a very helpful way to visualize information - especially when that information represents an infinite list of numbers! [latex]x\leq -4[/latex]. This translates to all the real numbers on a number line that are less than or equal to 4.Example
Graph the inequality [latex]x\ge 4[/latex]Answer:
We can use a number line as shown. Because the values for x include 4, we place a solid dot on the number line at 4.
Then we draw a line that begins at [latex]x=4[/latex] and, as indicated by the arrowhead, continues to positive infinity, which illustrates that the solution set includes all real numbers greater than or equal to 4.
![]()
Example
Write and inequality describing all the real numbers on the number line that are less than 2, then draw the corresponding graph.Answer:
We need to start from the left and work right, so we start from negative infinity and end at [latex]-2[/latex]. We will not include either because infinity is not a number, and the inequality does not include [latex]-2[/latex].
Inequality: [latex]\left(-\infty,-2\right)[/latex]
To draw the graph, place an open dot on the number line first, then draw a line extending to the left. Draw an arrow at the leftmost point of the line to indicate that it continues for infinity.
![]()
Represent inequalities using interval notation
Another commonly used, and arguably the most concise, method for describing inequalities and solutions to inequalities is called interval notation. With this convention, sets are built with parentheses or brackets, each having a distinct meaning. The solutions to [latex]x\geq 4[/latex] are represented as [latex]\left[4,\infty \right)[/latex]. This method is widely used and will be present in other math courses you may take. The main concept to remember is that parentheses represent solutions greater or less than the number, and brackets represent solutions that are greater than or equal to or less than or equal to the number. Use parentheses to represent infinity or negative infinity, since positive and negative infinity are not numbers in the usual sense of the word and, therefore, cannot be "equaled." A few examples of an interval, or a set of numbers in which a solution falls, are [latex]\left[-2,6\right)[/latex], or all numbers between [latex]-2[/latex] and [latex]6[/latex], including [latex]-2[/latex], but not including [latex]6[/latex]; [latex]\left(-1,0\right)[/latex], all real numbers between, but not including [latex]-1[/latex] and [latex]0[/latex]; and [latex]\left(-\infty,1\right][/latex], all real numbers less than and including [latex]1[/latex]. The table below outlines the possibilities. Remember to read inequalities from left to right, just like text. The table below describes all the possible inequalities that can occur and how to write them using interval notation, where a and b are real numbers.| Inequality | Words | Interval Notation |
|---|---|---|
| [latex]{a}\lt{x}\lt{ b}[/latex] | all real numbers between a and b, not including a and b | [latex]\left(a,b\right)[/latex] |
| [latex]{x}\gt{a}[/latex] | All real numbers greater than a, but not including a | [latex]\left(a,\infty \right)[/latex] |
| [latex]{x}\lt{b}[/latex] | All real numbers less than b, but not including b | [latex]\left(-\infty ,b\right)[/latex] |
| [latex]{x}\ge{a}[/latex] | All real numbers greater than a, including a | [latex]\left[a,\infty \right)[/latex] |
| [latex]{x}\le{b}[/latex] | All real numbers less than b, including b | [latex]\left(-\infty ,b\right][/latex] |
| [latex]{a}\le{x}\lt{ b}[/latex] | All real numbers between a and b, including a | [latex]\left[a,b\right)[/latex] |
| [latex]{a}\lt{x}\le{ b}[/latex] | All real numbers between a and b, including b | [latex]\left(a,b\right][/latex] |
| [latex]{a}\le{x}\le{ b}[/latex] | All real numbers between a and b, including a and b | [latex]\left[a,b\right][/latex] |
| [latex]{x}\lt{a}\text{ or }{x}\gt{ b}[/latex] | All real numbers less than a or greater than b | [latex]\left(-\infty ,a\right)\cup \left(b,\infty \right)[/latex] |
| All real numbers | All real numbers | [latex]\left(-\infty ,\infty \right)[/latex] |
Example
Describe the inequality [latex]x\ge 4[/latex] using interval notationAnswer: The solutions to [latex]x\ge 4[/latex] are represented as [latex]\left[4,\infty \right)[/latex]. Note the use of a bracket on the left because 4 is included in the solution set.
Example
Use interval notation to indicate all real numbers greater than or equal to [latex]-2[/latex].Answer: Use a bracket on the left of [latex]-2[/latex] and parentheses after infinity: [latex]\left[-2,\infty \right)[/latex]. The bracket indicates that [latex]-2[/latex] is included in the set with all real numbers greater than [latex]-2[/latex] to infinity.
Example
Use interval notation to indicate all real numbers between [latex]-3[/latex] and [latex]5[/latex], including [latex]5[/latex].Answer: Use a parenthesis on the left of [latex]-3[/latex] and a bracket after [latex]5[/latex]: [latex]\left[-3,5 \right)[/latex]. The bracket indicates that [latex]5[/latex] is included.
Think About It
In the previous examples you were given an inequality or a description of one with words and asked to draw the corresponding graph and write the interval. In this example you are given an interval and asked to write the inequality and draw the graph. Given [latex]\left(-\infty,10\right)[/latex], write the associated inequality and draw the graph. In the box below, write down whether you think it will be easier to draw the graph first or write the inequality first. [practice-area rows="1"][/practice-area]Answer:
We will draw the graph first.
The interval reads "all real numbers less than 10," so we will start by placing an open dot on 10 and drawing a line to the left with an arrow indicating the solution continues to negative infinity.
 To write the inequality, we will use < since the parentheses indicate that 10 is not included. [latex]x<10[/latex]
Set-builder notation
Another useful tool in specifying subsets of the real line is set-builder notation.A General Note: Set-Builder Notation and Interval Notation
Set-builder notation is a method of specifying a set of elements that satisfy a certain condition. It takes the form [latex]\left\{x|\text{statement about }x\right\}[/latex] which is read as, "the set of all [latex]x[/latex] such that the statement about [latex]x[/latex] is true." For example,[latex]\left\{x|4<x\le 12\right\}[/latex]
Interval notation is a way of describing sets that include all real numbers between a lower limit that may or may not be included and an upper limit that may or may not be included. The endpoint values are listed between brackets or parentheses. A square bracket indicates inclusion in the set, and a parenthesis indicates exclusion from the set. For example,[latex]\left(4,12\right][/latex]
Example: Describing Sets on the Real-Number Line
Describe the intervals of values shown below using inequality notation, set-builder notation, and interval notation.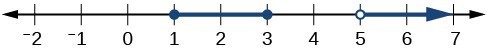
Answer: To describe the values, [latex]x[/latex], included in the intervals shown, we would say, " [latex]x[/latex] is a real number greater than or equal to 1 and less than or equal to 3, or a real number greater than 5."
| Inequality | [latex]1\le x\le 3\text{or}x>5[/latex] |
| Set-builder notation | [latex]\left\{x|1\le x\le 3\text{or}x>5\right\}[/latex] |
| Interval notation | [latex]\left[1,3\right]\cup \left(5,\infty \right)[/latex] |
Try It
Given the graph below, specify the graphed set in- words
- set-builder notation
- interval notation
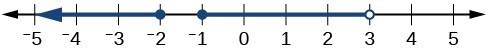
Answer: values that are less than or equal to –2, or values that are greater than or equal to –1 and less than 3; [latex]\left\{x|x\le -2\, \text{or}\,-1\le x<3\right\}[/latex]; [latex-display]\left(-\infty ,-2\right]\cup \left[-1,3\right)[/latex-display]
Licenses & Attributions
CC licensed content, Original
- Revision and Adaptation. Provided by: Lumen Learning License: CC BY: Attribution.
- Revision and Adaptation. License: CC BY: Attribution.
- Graph Linear Inequalities in One Variable (Basic). Authored by: James Sousa (Mathispower4u.com) for Lumen Learning. License: CC BY: Attribution.
CC licensed content, Shared previously
- Unit 10: Solving Equations and Inequalities, from Developmental Math: An Open Program. Provided by: Monterey Institute of Technology and Education Located at: https://www.nroc.org/. License: CC BY: Attribution.
- Ex: Graph Basic Inequalities and Express Using Interval Notation. Authored by: James Sousa (Mathispower4u.com) . License: CC BY: Attribution.
- College Algebra. Provided by: Lumen Learning Authored by: Jay Abramson, et al.. License: CC BY: Attribution.
- Ex: Solving One Step Inequalities by Adding and Subtracting (Variable Left Side). Authored by: James Sousa (Mathispower4u.com) . License: CC BY: Attribution.
- Ex: Solving One Step Inequalities by Adding and Subtracting (Variable Right Side). Authored by: James Sousa (Mathispower4u.com) for Lumen Learning. License: CC BY: Attribution.
- Ex: Solve One Step Linear Inequality by Dividing (Variable Left). Authored by: James Sousa (Mathispower4u.com) for Lumen Learning. License: CC BY: Attribution.
- Ex: Solve One Step Linear Inequality by Dividing (Variable Right). Authored by: James Sousa (Mathispower4u.com). License: CC BY: Attribution.
- Question ID 108347. Authored by: Coulston, Charles R. License: CC BY: Attribution.
- Question ID 3190, 3191. Authored by: Anderson, Tophe. License: Public Domain: No Known Copyright.
